
When the IT department of a company that had rolled out generative AI to every employee opened the usage logs, roughly a third of the workforce showed no trace of a login in the previous month. Asked why they were not using the tool, the non-users offered a single sentence: "The work gets done without it."
Licenses were distributed, training was delivered, a usage guide was written — and still the tool sits idle. Field reports from digital transformation consultants describe this scene again and again, and anyone who has led an AI rollout will recognize it.
Here is the uncomfortable part: this phenomenon — more than that, both the problem and its prescription — has long been an object of scholarly inquiry. No need to wait for the latest AI report — it sits in the classic literature on technology adoption, a body of work that begins with Everett Rogers' Diffusion of Innovations, published in 1962.
Sixty years of theory can be drawn onto a single map. And that map becomes a diagnostic kit for dissecting the typical ways AI adoption goes wrong.
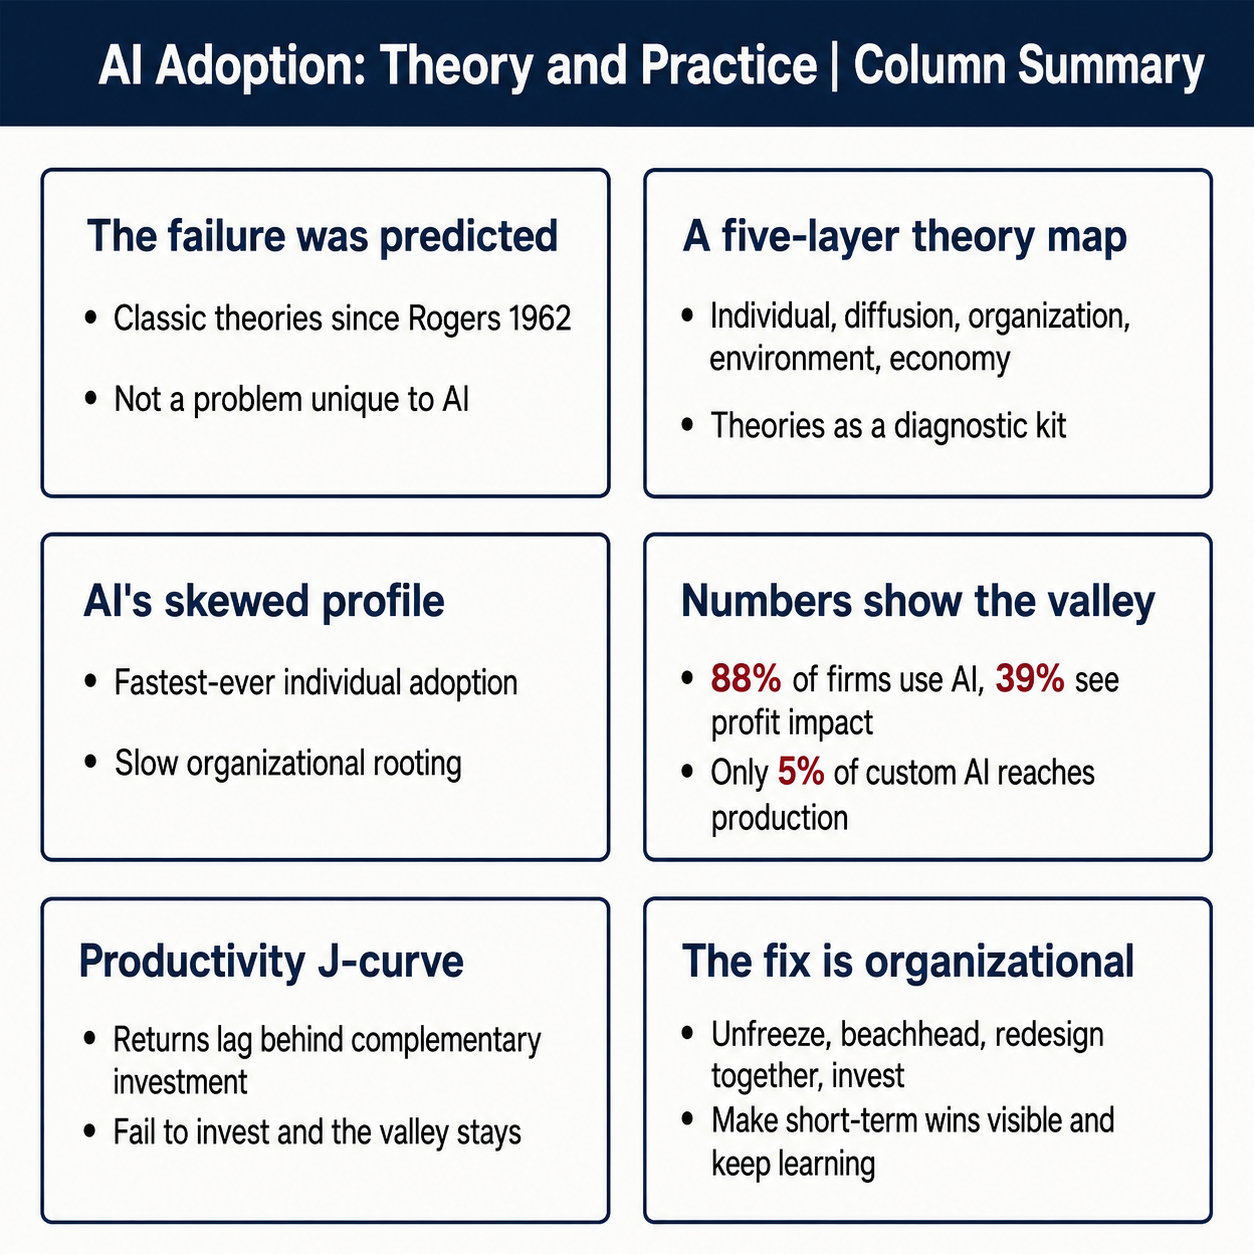
Part 1: The Classic Theories of Technology Adoption — The People Who First Doubted "Install It and It Works"
Why do new technologies spread, and why do they fail to take root? Behind this question stands a research tradition running 80 years, from rural sociology in the 1940s to the economics of the 2020s.
The theories sort themselves into five layers, by the altitude of what they examine:
- Individual — why does a single user start using it?
- Diffusion — how does it spread through a population?
- Organization — how should adoption be designed and run?
- Environment — what pushes adoption forward, and what blocks it?
- Economics — why do the results arrive late?
Theory is not an infallible authority. It becomes a usable tool only once you know the criticisms and limits behind its emblematic episodes — the parts that rarely make it into summaries.
Diffusion of Innovations — perception, not performance, decides diffusion
Everything starts with Diffusion of Innovations, published in 1962 by the sociologist Everett Rogers. His claim, when you press it to its core, is that whether a technology spreads is decided not by its objective performance but by how it appears in the eyes of those who would adopt it.
The backing came from field research in farming communities.
Why did hybrid seed corn, whose superior yield was already proven, take more than a decade to reach the farmers of Iowa? By gathering case after case like this, Rogers overturned the intuition that good things spread on their own.
"Getting a new idea adopted, even when it has obvious advantages, is difficult."
This sentence, placed at the opening of the book, was generalized into the universal question of how innovations penetrate a social system.
The theory rests on three pillars:
-
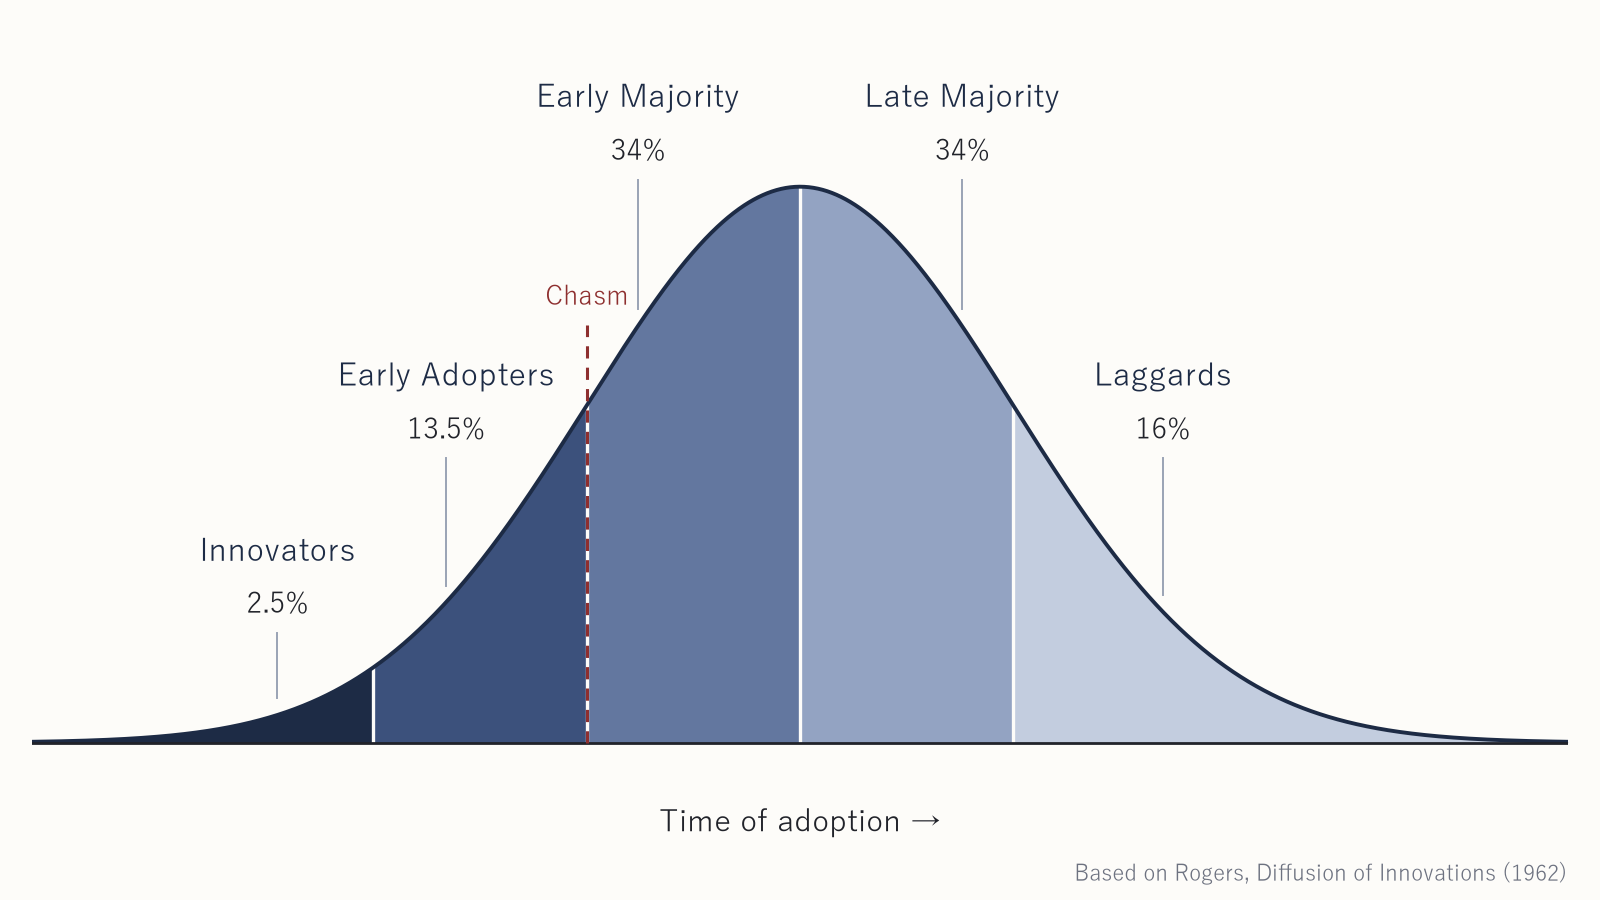
Adopters fall into five categories —
- Innovators (2.5%)
- Early adopters (13.5%)
- Early majority (34%)
- Late majority (34%)
- Laggards (16%)
Adoption timing follows a normal distribution.
-
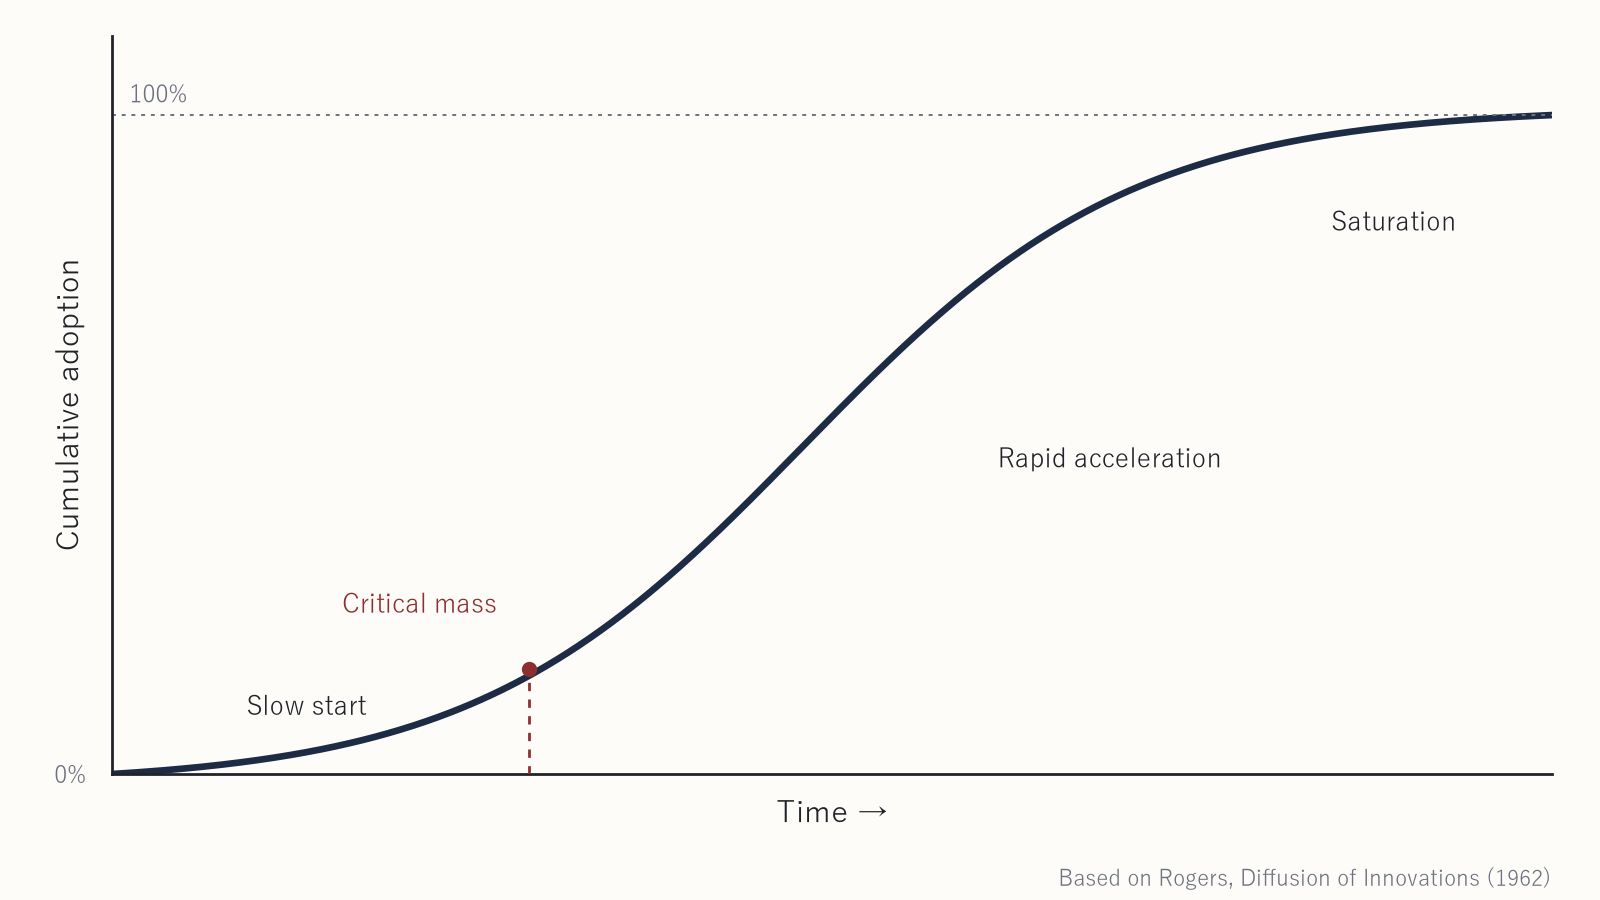
Cumulative adoption traces an S-curve — slow at first, accelerating sharply once opinion leaders move, then self-propagating past the critical mass.
-
The speed of diffusion is governed by five perceived attributes — relative advantage, compatibility, complexity, trialability, and observability.
- Relative advantage — how much better it appears than the existing way of doing things
- Compatibility — how well it seems to fit current values, work practices, and needs
- Complexity — how hard it feels to understand and master (the lower, the faster it spreads)
- Trialability — whether it can be tried on a small scale before full commitment
- Observability — whether the results of using it are visible to others
What is striking is that objective performance appears nowhere among the five.
In other words, the speed of diffusion is governed entirely by how the innovation appears to the people who might adopt it, not by the performance of the technology itself — perception alone, Rogers argued, explains 49–87% of the variance in adoption rates.
A tool whose performance nobody disputes going unused inside a company is, seen through Rogers' theory, not an exceptional event but an entirely ordinary one.
These five attributes can also be used as an instrument for explaining why ChatGPT reached individuals faster than any technology in history: free, instantly testable, with results visible on the spot — ChatGPT is a technology that scores textbook-perfect marks on trialability and observability.
The S-curve was later turned into mathematics by Frank Bass, whose 1969 differential-equation model became the standard for new-product demand forecasting. Of its two forces — a coefficient of innovation p for external pressure such as advertising, and a coefficient of imitation q for contact with existing adopters — later estimates showed diffusion driven overwhelmingly by q, the word-of-mouth side.
The success story at the next desk sets the speed of diffusion, more than any top-down announcement does — an implication that transfers directly to rolling out AI inside a company.
The first to concede the limits of the theory's reach was Rogers himself. In the fifth edition of Diffusion of Innovations (2003), he named two weaknesses of the research tradition: a pro-innovation bias that treats diffusion as unconditionally good, and a tendency to blame non-adoption on the individual.
Because its prototype is a simple individual adoption — a farmer and a bag of seed — the theory falls short for complex organizational technologies. The successor that drove straight at this weak point is Attewell's knowledge-barrier argument, discussed below.
The Chasm — early adopters and the majority are buying different things
It was Geoffrey Moore who, from the front lines of high-tech marketing, forced a correction onto Rogers' curve. The argument of his 1991 book Crossing the Chasm comes down to one point: a deep gap separates the early adopters from the early majority, and the two groups see different products in the same technology. Early adopters buy possibility; the early majority buys track records.
Early adopters are visionaries: for change and competitive advantage, they tolerate imperfection. The early majority are pragmatists, and the only references they consult are success stories from pragmatists like themselves.
Enthusiasm in the early market therefore does not propagate into the mainstream. Most products that succeed in the early market fall into this gap and disappear.
The prescription is twofold: the bowling pin strategy — seize a single niche market as a beachhead, then chain the track record into adjacent markets — and the whole product: assembling the complete offering, complementary services included.
Among researchers, its reputation is actually mixed: the standard criticism is that no systematic discontinuity can be confirmed in adoption curves and the argument rests on anecdote. Its practical explanatory power is nonetheless widely acknowledged, and the book remains the de facto textbook of high-tech market strategy.
Enterprise generative AI as of 2026 is mid-crossing. The companies that moved first are visionaries who tolerate imperfection; the majority of companies are pragmatists waiting for track records and settled accountability.
TAM and TOE — two perceptions for the individual, a receptacle for the organization
While diffusion theory was drawing curves over whole populations, Fred Davis narrowed the lens to a single individual's decision. Under his Technology Acceptance Model (TAM), presented in 1989, whether a person uses an information technology comes down to two perceptions: usefulness — will this improve my work results? — and ease of use — can I use this without much effort? What replication after replication showed is that usefulness is the stronger of the two.
For AI, these two axes precisely describe the suspended state so common today: "it seems useful, but I don't know how to use it in my own job" — that is, the work payoff looks real, but getting proficient takes effort. Showing concretely how the tool helps a person's actual work moves usage far more than polishing the interface.
At the level of the firm, this has a counterpart: the TOE framework, presented by Tornatzky and Fleischer in 1990. What it says is plain enough — that whether the technology is good does not, by itself, decide adoption, and a firm moves only when the organizational receptacle and the environmental pressure line up.
| Context | What it covers | Variables for generative AI |
|---|---|---|
| Technology | Characteristics of the technology itself | Model performance, cost, limits of accuracy |
| Organization | Size, slack resources, top-management support | Data infrastructure, AI talent, a program run directly under executives |
| Environment | Competitive pressure, regulation, supporting infrastructure | National AI regulation, industry guidelines, the vendor ecosystem |
The frequently observed pattern that large firms in heavily regulated industries adopt more cautiously is, viewed through this frame, no surprise at all.
Sociotechnical Systems Theory and Leavitt's Diamond — optimize one side and the whole breaks
Sociotechnical systems theory is the account of what happens inside the receptacle that TOE calls the organization. Its core proposition is that an organization is a dual structure of a technical system and a social system, and that optimizing only one degrades the whole. The proposition was born not at a desk but from a failure observed in Britain's coal mines in 1951.
In the traditional mines, small groups of multi-skilled workers autonomously handled the entire extraction cycle, sharing output and safety among themselves. The newly introduced mechanized method fragmented that cycle and replaced the groups with a line of single-skill roles. Judged by the machinery alone, efficiency was certain to rise.
The result was the opposite: absenteeism and conflict rose, and productivity fell. The cause that Trist and Bamforth of the Tavistock Institute identified was not the machines. The new method had destroyed the human side of the system that ran them — the integrity of the work and the fabric of mutual support.
Out of this came the prescription of joint optimization. Redesigning the technology and the social organization of the work as one is the condition of successful adoption.
Harold Leavitt abstracted the lesson into a general proposition with his 1965 diamond model. An organization is a system of four interdependent components — task, structure, technology, and people — and moving any one necessarily affects the other three.
Swap in new technology while leaving the definition of the work, the structure of approvals and division of labor, and people's skills and evaluation untouched, and the system falls into misalignment.
Generative AI adoption is the textbook case of pinching only the technology corner of this diamond and moving it alone. AI raises individual productivity while review workload piles onto particular people and collaboration collapses — reports like these from today's workplaces are, structurally, the same observation made underground.
Lewin and Kotter — change is a state transition, not an event
Granting that technology and organization must be rebuilt together, how is such a change set in motion inside an organization? The skeleton of the answer comes from the social psychologist Kurt Lewin, whose 1947 paper laid it out: change is a transition from state to state — nothing starts until the status quo is unfrozen, and nothing lasts until the new level is fixed in place.
Lewin saw an organization's present state as a quasi-stationary equilibrium — a balance between the forces pushing for change and the forces preserving the present. A temporary, shot-in-the-arm intervention therefore leaves group behavior sliding straight back to its previous level. An AI rollout that runs one training session, declares itself done, and evaporates within weeks was described more than seventy years in advance.
| Step | Essence | In an AI rollout |
|---|---|---|
| Unfreeze | Break the status-quo equilibrium | Management articulates "why AI, why now" and removes the reasons to stay put |
| Move | Shift to the new way of working | Redesign the workflow; allow trial and error |
| Refreeze | Fix the new level in place | Build the new procedures into standards, evaluation, and training |
The three steps come with an epilogue. When Cummings and colleagues examined the record in 2016, they found that Lewin never systematically presented this as a general model of change management; it was reconstructed after his death by textbook authors. Use the classics with their criticisms attached rather than swallowing them whole — the three steps are a first-class lesson in that, too.
John Kotter of Harvard Business School unfolded Lewin's skeleton into a practitioner's handbook. Distilling the common failure patterns from observing more than 100 transformations, he inverted them into an eight-step sequence in a 1995 article and the following year's book Leading Change.
| Step | What to do | What it means for AI adoption |
|---|---|---|
| 1 Establish urgency | Share, with facts, why change cannot wait | Management states the reason before any tool is distributed; skipping this is the most frequent failure |
| 2 Build a guiding coalition | Assemble a team with authority and trust | Involve respected field leaders, not just the AI program office |
| 3 Develop a vision and strategy | Define the destination and the path | Make "what we stop doing, how we work with AI" sayable in one line |
| 4 Communicate the vision | Repeat it through every channel | Design on the premise that one-tenth of the required volume gets through |
| 5 Remove obstacles | Clear structural and institutional blockers | Rebuild the approvals, rules, and evaluation that obstruct AI use |
| 6 Generate short-term wins | Engineer early, visible victories | Build results measurable at 3–6 months into the plan from the start |
| 7 Consolidate and accelerate | No victory declarations; reinvest in the next change | Do not stop at the PoC success announcement; extend to adjacent work |
| 8 Anchor in the culture | Make the new way the organizational standard | Embed the new procedures in hiring, evaluation, and training |
The heart of the eight steps is step six, short-term wins. Visible victories are what keep procuring internal support while the organization crosses the trough of the productivity J-curve, discussed below. The warnings that "skipping steps creates only the illusion of speed" and that declaring victory too soon kills the transformation are inseparable from the sequence.
The definitive critique is a 2012 review by Appelbaum and colleagues: individual steps have supporting studies, but no empirical research has validated the eight-step model as a whole. The sequence is a diagnostic instrument, not a warranty that following the steps guarantees success — use it with that caveat attached.
Attewell's Knowledge Barriers — knowing about it and mastering it are different things
In 1992, the sociologist Paul Attewell stepped into the weak point Rogers had left behind. What he demonstrated is that complex technologies do not spread once the information about them spreads; they spread only once the organization has learned to master them.
Classical diffusion theory implicitly assumed that to know is to adopt. What Attewell showed, from the history of business computing in the United States, is that for complex technologies this premise collapses.
Firms hesitate to adopt not because they do not know about the technology but because the know-how to master it has not yet accumulated inside the organization — this knowledge barrier is the bottleneck that sets the speed of diffusion.
No company today is unaware that ChatGPT exists. Yet the know-how of where to use it in your own department's work, and how to verify the output, does not travel the way information does.
Attewell drew attention, further, to mediating institutions that lower the barrier. In the 1950s, American firms first outsourced their computing to service bureaus, externalizing the cost of learning, and moved in-house only after the knowledge had accumulated — diffusion as the step-by-step internalization of know-how.
The rapid growth of AI implementation vendors and corporate AI training businesses today is nothing other than a rerun of the mediating-institutions story.
From the Productivity Paradox to the J-Curve — not ineffective, just not yet on the books
Even with adoption and embedding accounted for, one question remains: when, and where, do the results of the technology appear? The answer economics took forty years to produce is, in summary, that results fail to appear not because the technology does not work, but because for as long as the organizational investment needed to make it work continues, the books can only show a minus.
The starting point is 1987 and one line the Nobel laureate economist Robert Solow wrote in the New York Times book review pages.
"You can see the computer age everywhere but in the productivity statistics."
Not even a paper — a single sentence became the canonical formulation of the "productivity paradox."
It was more than a quip. US IT investment was surging at the time while labor productivity growth actually slowed.
The economist Erik Brynjolfsson converted the riddle into a research agenda in a 1993 paper. His four-way sorting of the candidate explanations is still in service.
-
Mismeasurement — gains in quality and convenience never show up in productivity statistics
-
Lags — learning and organizational adjustment delay the effects by years, even a decade or more
-
Redistribution — IT is used to fight over competitive advantage; one firm's gain need not enlarge the industry's pie
-
Mismanagement — investment in the wrong targets, run the wrong way
The first half of the answer came in 2000, when Brynjolfsson and Hitt showed it in firm-level data. IT's value comes not from the computers alone but from their combination with complementary investments in business processes, organizational structure, and human capital — and those organizational investments can reach up to ten times the hardware investment.
Behind every dollar of technology, up to nine dollars of invisible investment.
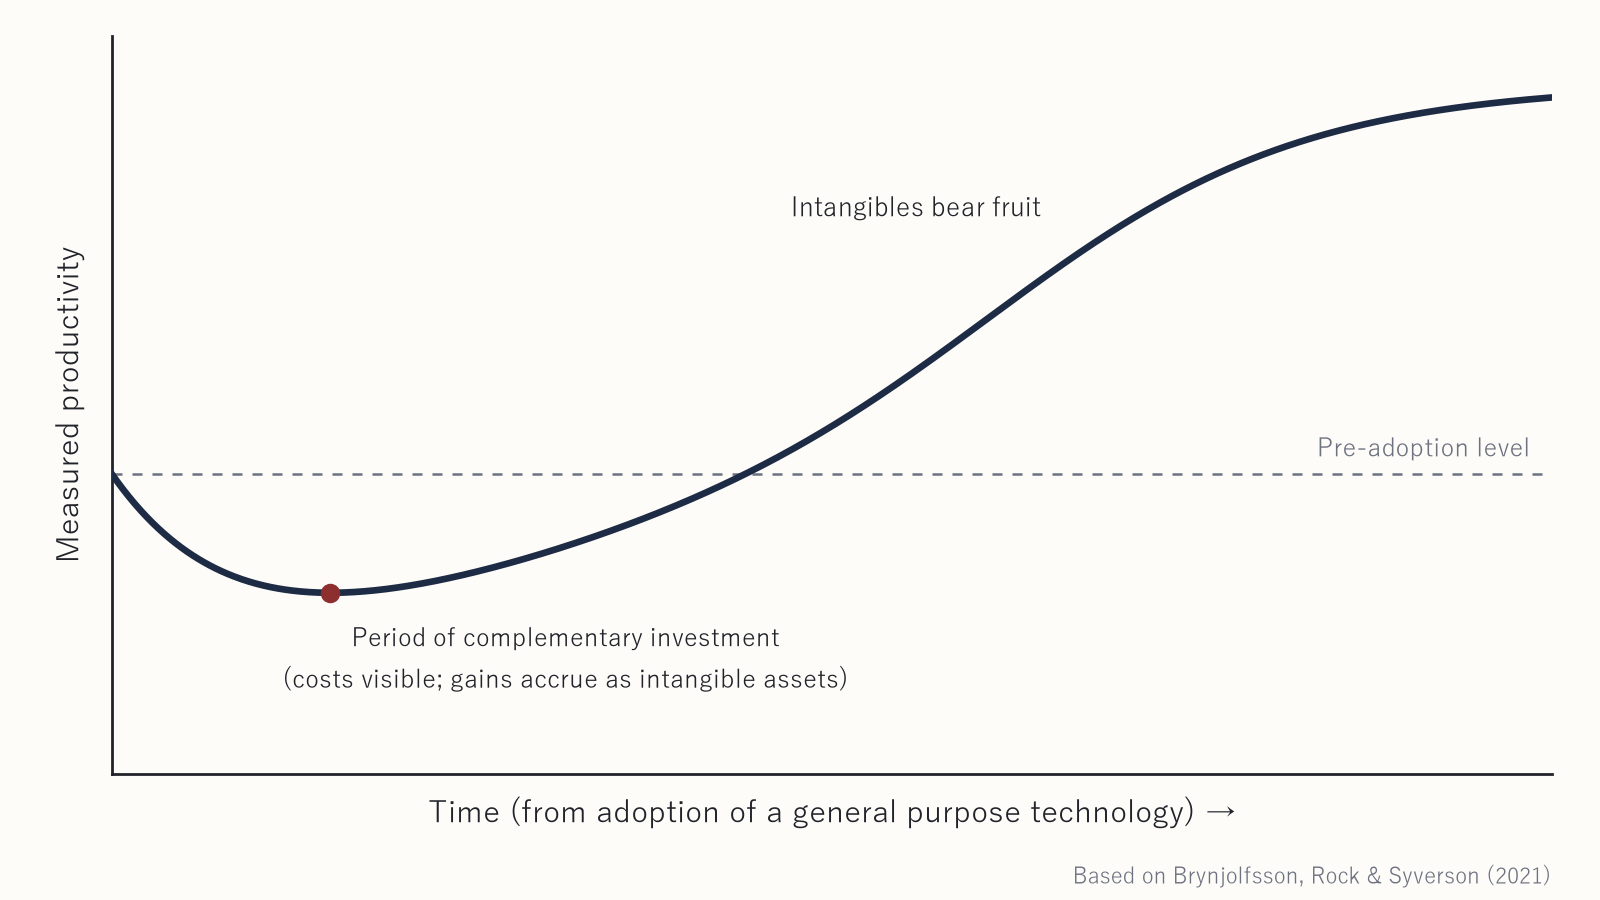
The second half is the productivity J-curve, published in 2018 by Brynjolfsson, Rock, and Syverson. General purpose technologies like electricity and the computer demand up-front investment in intangible assets — process redesign, workforce development.
Because that investment goes largely uncounted in national accounts, the early phase shows only costs, and measured productivity sinks first. Only when the intangibles begin to bear fruit does the statistic jump. Sink, then jump — plot the trajectory and it draws the letter J.
By their estimate, adjusting for computer-related intangible assets leaves US total factor productivity 15.9% higher than the official statistics as of end-2017. It rhymes with the economic historian Paul David's finding that after the introduction of electricity, factories needed roughly thirty years of layout redesign before the productivity statistics responded.
One caveat, underlined by the authors themselves: the J-curve does not guarantee eventual recovery. For an organization that fails at the complementary investments, the trough stays a trough.
Folded into one page — a five-layer map of the theories
The theories above are not rivals. They are five photographs of the same phenomenon taken from different altitudes — and layered together, they become a single map.
| Layer | Central question | Theories (author, year) |
|---|---|---|
| Individual | Why does one person use it? | Technology Acceptance Model (Davis 1989), UTAUT (Venkatesh et al. 2003) |
| Diffusion | How does it spread through a group? | Diffusion of innovations (Rogers 1962), Bass model (Bass 1969), the chasm (Moore 1991) |
| Organization | How should adoption be designed? | Three steps (Lewin 1947), eight steps (Kotter 1995), sociotechnical systems theory (Trist & Bamforth 1951), the diamond (Leavitt 1965), knowledge barriers (Attewell 1992) |
| Environment | What decides adoption? | TOE framework (Tornatzky & Fleischer 1990) |
| Economics | Why do results lag? | Productivity paradox (Solow 1987, Brynjolfsson 1993), complementary investments (Brynjolfsson & Hitt 2000), productivity J-curve (Brynjolfsson et al. 2018) |
One conclusion runs through all five layers.
Technology does not work just because you install it. Adoption begins in human perception, diffusion has a fault line, embedding requires organizational redesign, and results arrive late, after complementary investment.
Part 2: Why AI Adoption Fails — the Classics as a Diagnostic Kit
The premise — AI is a general purpose technology
Before laying Part 1's map over AI, one premise needs fixing: generative AI is a general purpose technology in the same class as electricity and the computer.
Brynjolfsson and colleagues positioned AI as a general purpose technology (GPT) in a 2017 paper. A GPT is not a finished end product in itself; it is a foundational technology that gets built into every kind of process and induces large volumes of complementary co-invention.
Note: GPT here (General Purpose Technology) is an economics term — a separate concept from the "GPT" in ChatGPT (Generative Pre-trained Transformer).
The same conclusion can be reached from the microeconomic side. In their 2018 book Prediction Machines, Agrawal and colleagues at the University of Toronto redefined the essence of today's AI as a dramatic drop in the cost of prediction, and argued that the cheaper prediction becomes, the more the value of its complements rises — human judgment, data, and workflows.
From either definition, AI structurally carries three properties: it does not work standalone, it requires complementary investment, and its results arrive late. That is why the entire body of theory in Part 1 applies to it directly.
What is more, generative AI differs from electricity or ERP in that an individual can start using it today. It is a technology that tests all five layers — individual, diffusion, organization, environment, economics — at once, simultaneously.
Rogers' scorecard — five attributes, extremely skewed
Grading generative AI against the five attributes of diffusion theory reveals a profile skewed to a degree rare in the history of technology.
| Perceived attribute | AI's score | Basis |
|---|---|---|
| Relative advantage | Very high | Dramatic time savings in writing, code, and analysis; the advantage itself is rarely disputed |
| Trialability | Very high | Free to try within minutes — among the most trialable technologies in history |
| Complexity | High (unfavorable) | The gap between "can use it" and "can master it" is enormous; prompt design, verification, and knowing the limits are required |
| Compatibility | Low (unfavorable) | Clashes with established work practices — approval processes, division of labor, quality control, accountability |
| Observability | Low (unfavorable) | Use is confined to the individual's screen and never surfaces as organizational results |
Because relative advantage and trialability are extraordinarily high, individual adoption proceeded faster than for any technology in history. Meanwhile complexity, compatibility, and observability drag it down, so organizational embedding lags behind.
"All our employees use it, yet nothing changes for the company" — this split, playing out at firm after firm, is called almost exactly by the five attributes of 1962. This scorecard becomes the instrument for diagnosing the five typical symptoms of AI adoption that follow.
Symptom 1: Distribute and done — the coal mine, replayed
Return to the company in the opening scene. A third of employees with zero logins in a month is by no means an extreme case.
Uchida Yoko, a Japanese office solutions firm that rolled out an AI assistant company-wide, has disclosed what sat behind its honor-roll figure of roughly 95% active usage: only about 40% of employees used the tool three or more days a week, and that 40% accounted for roughly 80% of total usage.
The blockers the company names are a psychological hurdle — "if I can't use a tool this simple, something is wrong with me" — and a missing method: not knowing what to even ask.
Consultants at NTT DATA report a surge of inquiries of the form "we distributed the licenses, ran the training, wrote the guide — and sales still won't use it," and what comes back from the field is "in the end, my own way is faster."
It is tempting to locate the cause in people — insufficient literacy, resisters — but the field reports converge on one point: that is a result, not a cause.
The diagnosis is clear-cut. This is the coal mine replayed — what sociotechnical systems theory described in 1951 as optimizing the technical system alone.
The technical system, the tool, was renewed. But the social system — workflow, division of labor, evaluation, accountability — was left as it was. In Leavitt's diamond: the technology corner was moved while task, structure, and people were left in place, so the whole system is out of alignment.
The numbers back this up. In Brynjolfsson and Hitt's estimate, IT results required organizational investment of up to ten times the technology investment.
Fountaine and colleagues at McKinsey likewise argued in a 2019 Harvard Business Review article that the biggest barrier to AI is organization and culture, not technology, and that more than half of the budget for algorithm development should go to integration and adoption.
A joint study by MIT Sloan Management Review and Boston Consulting Group quantified the pattern. Surveying more than 3,000 executives worldwide, it found that only about 10% of companies obtain significant financial benefits from AI, and that getting the basics right — data, talent, strategy — lifts the odds of success only to about 20%.
Only the companies that went all the way to organizational learning — humans and AI learning from each other, with roles and processes repeatedly redesigned — raised their odds to about 73%.
Iansiti and Lakhani of Harvard Business School reached the same diagnosis in their 2020 book: results fail to appear because AI is being loaded onto the existing organizational architecture, and they prescribe rebuilding the firm around a data-centric operating model.
"The work gets done without it" is, in fact, an accurate status report. If the work is still designed to run without AI, of course it runs without AI. What needs changing is neither the tool nor the employees but the design of the work itself.
Symptom 2: Pilot purgatory — the bottom of the in-house chasm
The next symptom is pilot purgatory: proofs of concept that succeed and never advance to production.
At one manufacturer, a pilot of an AI system for cross-searching engineering drawings and meeting minutes comfortably met its accuracy targets. Yet "who on the shop floor will use it, for how many minutes a day" was never defined, management could not make the investment decision, and the project stopped — a textbook case of passing as technology and dying as a business.
There are numbers for the scale. A survey published in 2025 by an MIT research project reported that only about 5% of custom-built enterprise generative AI reaches production, and that 95% of an investment wave of 30 to 40 billion dollars is producing no measurable return to the P&L.
That "95%," however, is a number that easily takes on a life of its own. The study is a preliminary version, the sample is not randomly drawn, and failure is defined as "no measurable impact on the income statement."
Moreover, the same report states plainly that at the individual level AI is already changing how work gets done. The accurate reading is not "95% of enterprise AI fails" but "95% of custom pilots have not crossed the wall into production."
Why does a pilot that passes as technology fail to advance to production? The diagnostic frame is Moore's chasm. The AI program office and the pioneer departments are visionaries: they buy potential and tolerate imperfection.
But the majority in the field are pragmatists, and the only evidence they believe is a demonstration in their own line of work. The program office's dazzling demo is no material for persuading the department next door.
A contrasting pair of cases reported by Davenport and colleagues in 2018 points the way to the prescription. At the very hospital where a cancer-diagnosis AI — roughly 62 million dollars invested — was suspended without ever being used in care, unglamorous AI for hotel recommendations and help desks was steadily improving satisfaction and financials.
Their conclusion, from examining 152 enterprise AI projects: start not with the moonshot but with the fruit within reach.
A number consistent with Attewell's mediating-institutions argument appears in the MIT survey as well: implementations built with external partners succeeded about 67% of the time, far above the roughly 33% for internal builds. Knowledge barriers are crossed faster by learning from someone who knows the crossing than by scaling them alone.
The prescription is the bowling pin strategy. Not a simultaneous company-wide rollout: seize, as a beachhead, a single business process where return on investment and safety can be demonstrated, then chain that track record to adjacent departments where it can be told in the language of their own work.
Symptom 3: Shadow AI — diffusion completing itself outside governance
The third symptom is paradoxical. Outside the company's control, AI diffusion is already well underway.
In a survey conducted in the fall of 2025 by SIGNATE, a Japanese AI talent company, 34.8% of respondents with high motivation to use generative AI were using AI tools for work without their company's permission — recording meetings on a personal smartphone, generating minutes with a free transcription AI, and sharing them.
The MIT survey cited above makes the same observation: while the share of companies with official LLM contracts stays at about four in ten, in over 90% of companies employees routinely use personal AI tools for work.
US worker panels point in the same direction. In Gallup's 2025 survey, 45% of US employees use AI at work at least a few times a year, while only 22% say their organization has communicated a clear AI strategy. Pew Research Center's survey likewise finds workers who use AI for at least part of their job rising to 21%.
Note that the headline 45% includes people who use it only a few times a year; daily users are 10%. "Usage rate" is a number that swings widely with its definition — the same caution applies when reading your own company's logs.
Translated into Rogers' vocabulary, this is the collapse of observability. Diffusion is happening inside personal screens, invisible to the organization. In Bass's vocabulary: the imitation coefficient q is already running at full throttle, and the organization has failed to harness that force in its design.
The governance-side reflex is often a blanket ban. But what the surveys consistently show is that bans do not stop use; they merely push it out of sight. If the outcome is entrusting data-leakage risk to personal free-tier tools, the control defeats its own purpose.
Shadow AI is therefore a demand signal before it is a discipline problem.
In a survey by Persol Research and Consulting, generative AI use among Japanese workers stood at 32.4%, and the top reasons for non-use were "I don't see the need in my own work" and "I don't know how to use it." Where the official tool has not been connected to the needs of the work, individuals are quietly completing the connection on their own — that is the picture that emerges.
Here Attewell's knowledge-barrier argument turns into the prescription. A mechanism for internalizing individually accumulated know-how into organizational assets — case sharing, prompt standardization, hands-on support — is what should be built before any prohibition is issued.
Symptom 4: No visible results — the J-curve trough, or just a miss?
The fourth symptom is the standing question of every executive meeting: with all this usage, where is the profit?
The data disagree with each other across three layers.
-
In task-level experiments, AI works — in a quasi-experiment covering more than 5,000 call-center agents, resolutions per hour rose 15% on average, with the effect reaching 34% for novice workers and nearly zero for the most experienced.
In an experiment on writing tasks with college-educated professionals, time required fell 40%; in an experiment with 758 Boston Consulting Group consultants, quality improved 40% on tasks inside AI's frontier.
-
In firm-level surveys, it fails to reach profit — in McKinsey's 2025 annual survey, 88% of organizations use AI, but only 39% could confirm an impact on EBIT, and for most of those the contribution was under 5%.
In Boston Consulting Group's 2024 survey, only 26% of companies generate visible value beyond the pilot stage.
-
In macro statistics, almost nothing yet — by Goldman Sachs' analysis, on major US companies' earnings calls for the October–December quarter of 2025, 70% of executive teams mentioned AI while 1% quantified an impact on profit.
Among the companies that could quantify it, median productivity gains of about 30% were reported in two use cases: customer support and software development.
These figures all come from self-reported surveys or experiments under specific conditions, with differing definitions and samples, so they cannot be compared directly. Still, the direction is consistent: it works at the micro level yet fails to convert into P&L and statistics.
And yet investment does not stop. In Boston Consulting Group's 2026 survey, 50% of CEOs answered that their own job is at risk if AI fails to deliver — while 94% said they would continue or expand investment even without ROI over the coming year. Executives themselves, it seems, have begun to price in the existence of the trough.
There are also experiments that shake the ground underfoot. In a randomized experiment run in 2025 by the research institute METR, veteran developers working in large codebases they knew intimately completed their tasks 19% slower when using AI. The astonishing part was the gap with perception: even after finishing, the participants believed they had been 20% faster.
The authors themselves note the caveats — 16 developers, and conditions chosen where AI's gains are hardest to realize. Even so, as a warning against investment decisions grounded in perceived productivity gains, it is first-rate.
In the consultant experiment above, on tasks outside AI's frontier, users' accuracy actually fell 19 percentage points — discerning where AI helps and where it harms has itself become a new job skill.
This three-layer divergence is Solow's one-liner replayed. You can see the AI age everywhere — except in the income statement and the productivity statistics.
The optimists' interpretation is the J-curve: we are now in the trough where complementary investment in intangibles runs ahead, and, as with electricity, the statistics will jump once accumulation crosses the threshold. In 2026, San Francisco Fed President Mary Daly likewise urged judgment that does not rely on official statistics alone, noting that transformative technologies appear in micro data before they appear in macro statistics.
The standard-bearer for caution is the MIT economist Daron Acemoglu. In a 2024 paper, building up from task structure, he estimated that generative AI will lift total factor productivity by at most 0.66% over the next ten years.
AI excels at routine, learnable tasks and loses reliability precisely on the difficult, high-value ones — that asymmetry between expectation and capability is the basis of his modest figure.
The two camps agree that the trough exists; what divides them is the height of the mountain beyond it. In 2026 there are signs on the optimists' side — researchers at the San Francisco Fed estimated a rising probability that the US has entered a high-productivity regime — but disentangling how much of that is driven by AI investment itself remains unresolved.
For management, the implication is double-edged. The absence of results is insufficient grounds for retreat — and "it's a J-curve, it will jump eventually" is equally insufficient grounds for continued investment. As the J-curve paper itself states, for organizations that fail at the complementary investments, the trough stays a trough.
Symptom 5: Japan's lag — the inhibiting conditions, fully satisfied
The final symptom is a fault line at the level of nations.
According to the 2025 edition of the White Paper on Information and Communications by Japan's Ministry of Internal Affairs and Communications, 26.7% of individuals in Japan have used generative AI, against 68.8% in the United States and 81.2% in China. On corporate policy, the combined share of firms "actively using" AI or "using it in limited domains" is 49.7% in Japan, far behind 92.8% in China and 84.8% in the United States.
Japan's individual usage roughly tripled from 9.1% the year before, and among people in their twenties it reaches 44.7% — so the picture is not standstill but a late start now accelerating.
In Teikoku Databank's March 2026 survey, 34.5% of companies use generative AI in their operations, double the level of two years earlier; yet in PwC's international comparison, the share of Japanese companies achieving results that "exceeded expectations" was one-quarter the level of the United States or the United Kingdom.
The fault line also runs inside the country. In the ministry's survey, about 56% of large companies have set a policy on AI use, against about 34% of small and mid-sized firms. In Teikoku Databank's survey, 86.7% of adopting companies report tangible benefits, while 18.8% voice concern about "a widening gap in AI proficiency."
In PwC's survey, roughly 60% of the Japanese companies whose results "greatly exceeded expectations" run their AI programs directly under the CEO. The organization-context variable of executive commitment shows up directly as the difference in results.
This lag is routinely narrated as a literacy problem, but applying the theories from Part 1 returns a different diagnosis.
Standard Japanese corporate practice satisfies, almost exhaustively, the inhibiting conditions the theories list under "how to make sure a technology does not take root."
- The culture of ringi — Japan's document-based consensus approval process — and of prior alignment maximizes what Rogers calls the lack of compatibility
- The reference behavior of waiting for other companies' results is late-majority behavior at the scale of a whole population; it stalls just short of the chasm
- Demerit-based evaluation impoverishes the soil in which innovators and early adopters grow
- Tool-distribution-style adoption walks straight past the joint optimization that sociotechnical systems theory teaches
- Single-year budget cycles misread the J-curve trough as "failure" and choose retreat
In TOE vocabulary: the technology context is common to every country, so if the organization and environment contexts differ, adoption naturally differs. Turned around, this is a problem of design variables, not of national character as an unchangeable constant. If the inhibiting conditions match the theory, the prescription can be written from the theory as well.
The diagnostic table — symptoms, theories, prescriptions
Folding Part 2 into a single page yields the table below. Usage is simple: find your company's symptom in the left column, go back to the corresponding theory's section, and translate the right column into the language of your own operations.
| Symptom | Diagnosis (theory) | Prescription |
|---|---|---|
| Distribute and done — nobody uses it | Sociotechnical systems theory, Leavitt's diamond | Redesign workflow, roles, and evaluation at the same time as the tool |
| Pilot purgatory — never reaches production | Moore's chasm | Prove value in a single beachhead process, then chain into adjacent work of the same kind |
| Shadow AI | Rogers' observability, Attewell's knowledge barriers | Design sharing rather than bans; internalize individual know-how into organizational assets |
| No visible results | Solow's paradox, the productivity J-curve | Make progress through the trough visible with intermediate metrics; sustain complementary investment |
| No results, instant retreat | The J-curve trough, Kotter's short-term wins | Deliberately engineer visible wins within 3 to 6 months |
| Herd behavior without urgency | Lewin's failed unfreezing, TOE's environment context | Management articulates "why now" and breaks the status-quo equilibrium |
The sequence the theories imply — seven moves to make AI stick
Reordering the diagnostic table along a timeline turns the theories directly into an implementation plan.
-
Unfreeze — following Lewin: management articulates "why AI, and why now" in its own words and breaks the status-quo equilibrium. Distributing a tool is not unfreezing.
-
Choose the beachhead — following Moore: start with a single business process where the relative advantage is obvious and trial is easy. A simultaneous company-wide rollout is a design for falling into the chasm.
-
Redesign concurrently — following sociotechnical systems theory and Leavitt: rebuild workflow, roles, evaluation, and accountability on the same schedule as the tool.
-
Fund the complements — following Brynjolfsson: allocate a budget at least equal to the license fees to process redesign, data readiness, and people development.
-
Run the organizational learning loop — following Attewell: institutionalize the use-verify-improve cycle so that know-how accumulates in the organization, not in individuals.
-
Make short-term wins visible — following Kotter: artificially raise what Rogers calls observability. This is the political engineering that procures internal support in the middle of the trough.
-
Keep learning instead of refreezing — Lewin's refreezing needs rereading in an era when models are replaced every few months. What gets locked in is not any particular procedure but the learning mechanism itself.
The order carries meaning. A beachhead cannot be chosen before unfreezing, and results cannot be made visible before the complementary investment. To borrow Kotter's warning: skipping steps creates only the illusion of speed.
The right way to use a 60-year-old textbook
One question remains: how to handle the classics themselves.
As Part 1 noted, the classic theories are not unscathed. Lewin's three steps carry the epilogue of posthumous reconstruction; Kotter's eight steps lack an empirical study validating the whole; the chasm has never stopped hearing that it is anecdotal. If you brandish theory as an authority, its foundations deserve the same degree of scrutiny.
Even so, the reason these theories survived sixty years is clear. Each has kept correcting, from its own angle, the same intuitive error humans repeat every time: "install the technology and it works."
Technological progress is exponential while organizational adaptation is linear — the gap Brynjolfsson and McAfee pointed to in 2014 in The Second Machine Age only widens as AI's generational turnover accelerates.
What separates success from failure in AI adoption is not the performance of the models. It is how deliberately you can move the organizational variables that have had names for half a century: compatibility, observability, joint optimization, complementary investment, short-term wins.
This is, in its way, good news for management. The model performance race is beyond any single company's control, but the organizational variables all lie within the boundary of your own decisions. The performance of tools can be bought; organizational learning cannot — and the difference is made by the one that cannot be bought.
Return, finally, to "the work gets done without it." The correct response to that sentence was never additional training or usage quotas: it was to redesign the work itself so that the work gets done better with AI. Do not bend people to the tool; change the design of the work — that is the unanimous conclusion of the classics.
A sixty-year-old textbook does not contain the answers about AI. It does, however, contain all of the questions. Compared with us — who forget the questions every time the technology is new — the textbook may simply have the better memory.
Frequently Asked Questions
Is it true that 95% of AI initiatives fail?
The figure comes from a 2025 survey by an MIT research project, and its precise meaning is that of custom-built enterprise generative AI pilots, only about 5% reached production and the P&L.
The study is a preliminary version with a biased sample, and the same survey also reports that individual-level adoption is advancing rapidly. Reading it as "95% of all AI fails" is a mistake.
Why don't employees use the generative AI we rolled out?
As the Technology Acceptance Model shows, the strongest driver of use is the perception that "this improves the results of my own work." If the work is still designed to run without AI, not using it is precisely the rational behavior. Before more training, what is needed is a change in the design of the work so that using AI becomes the default assumption.
How do we avoid getting stuck at the proof-of-concept stage?
Before the pilot starts, define who will use it, in which process, saving how many minutes, and where that lands in the P&L — and fix the criteria for moving to production in advance. Then, following chasm theory, design the rollout not as a company-wide launch but as a chain from a single provable process into adjacent ones.
When do the effects of AI investment appear, and how should we explain this to leadership?
The productivity J-curve's finding is that the effects of a general purpose technology stay out of the statistics until complementary investments accumulate; in the early phase, measured results actually sink. The standard play is therefore to track progress through the trough with intermediate metrics such as time saved and quality rather than bottom-line profit, and to deliberately engineer what Kotter calls short-term wins.
How should we deal with frontline teams that resist AI?
In the classic diagnosis, resistance is a result, not a cause. Employees who do not use AI are merely responding rationally to work that is designed to run without it and to evaluation systems that penalize failure. Before changing people, move the design variables of compatibility and observability — that is the order the theory prescribes.
Why is AI adoption slow at Japanese companies?
In the international comparison by Japan's Ministry of Internal Affairs and Communications, Japan trails the leading countries in both individual use and corporate adoption, but the theoretical diagnosis is not a literacy deficit. The lack of compatibility created by the ringi consensus culture, reference behavior that waits for peers' results, demerit-based evaluation, tool-distribution rollouts, single-year budgets — the cause is this stack of textbook inhibiting conditions, every one of which is a variable that design can change.
References
- Diffusion of Innovations, 5th Edition — Everett M. Rogers (Google Books)
- A New Product Growth for Model Consumer Durables — Frank M. Bass (Management Science)
- Crossing the Chasm — Geoffrey A. Moore (author's official site)
- Perceived Usefulness, Perceived Ease of Use, and User Acceptance of Information Technology — Fred D. Davis (MIS Quarterly)
- A Theoretical Extension of the Technology Acceptance Model — Venkatesh and Davis (Management Science)
- User Acceptance of Information Technology: Toward a Unified View — Venkatesh et al. (MIS Quarterly)
- Frontiers in Group Dynamics — Kurt Lewin (Human Relations)
- Field Theory in Social Science — Kurt Lewin (Open Library)
- Leading Change: Why Transformation Efforts Fail — John P. Kotter (Harvard Business Review)
- Some Social and Psychological Consequences of the Longwall Method of Coal-Getting — Trist and Bamforth (Human Relations)
- Applied Organizational Change in Industry — Harold J. Leavitt (Handbook of Organizations reprint)
- The Processes of Technological Innovation — Tornatzky and Fleischer (Google Books)
- Technology Diffusion and Organizational Learning — Paul Attewell (Organization Science)
- Solow's Computer Age Quote: A Definitive Citation (Stand-Up Economist)
- The Productivity Paradox of Information Technology — Erik Brynjolfsson (Communications of the ACM)
- Beyond Computation — Brynjolfsson and Hitt (Journal of Economic Perspectives)
- The Productivity J-Curve — Brynjolfsson, Rock and Syverson (American Economic Journal: Macroeconomics)
- Artificial Intelligence and the Modern Productivity Paradox — Brynjolfsson, Rock and Syverson (NBER)
- The Simple Macroeconomics of AI — Daron Acemoglu (NBER)
- Prediction Machines: The Simple Economics of Artificial Intelligence — Agrawal, Gans and Goldfarb (Harvard Business Review Press)
- Competing in the Age of AI — Iansiti and Lakhani (Harvard Business Review Press)
- The Second Machine Age — Brynjolfsson and McAfee (W. W. Norton)
- Artificial Intelligence for the Real World — Davenport and Ronanki (Harvard Business Review)
- Building the AI-Powered Organization — Fountaine, McCarthy and Saleh (Harvard Business Review)
- Expanding AI's Impact With Organizational Learning — Ransbotham et al. (MIT Sloan Management Review × BCG)
- Unfreezing change as three steps: Rethinking Kurt Lewin's legacy — Cummings, Bridgman and Brown (Human Relations)
- Back to the future: revisiting Kotter's 1996 change model — Appelbaum et al. (Journal of Management Development)
- The Legacy of the Technology Acceptance Model — Richard P. Bagozzi (Journal of the AIS)
- Quo vadis TAM? — Benbasat and Barki (Journal of the AIS)
- The GenAI Divide: State of AI in Business 2025 — MIT NANDA (report PDF)
- The State of AI in 2025 — McKinsey & Company
- AI Adoption in 2024: 74% of Companies Struggle to Achieve and Scale Value — BCG (PR Newswire)
- AI Use at Work Has Nearly Doubled in Two Years — Gallup
- AI Use at Work Rises — Gallup
- About 1 in 5 U.S. workers now use AI in their job — Pew Research Center
- Generative AI at Work — Brynjolfsson, Li and Raymond (NBER)
- Experimental evidence on the productivity effects of generative artificial intelligence — Noy and Zhang (MIT, PDF)
- Centaurs and Cyborgs on the Jagged Frontier — commentary on the Dell'Acqua et al. experiment (One Useful Thing)
- Measuring the Impact of Early-2025 AI on Experienced Open-Source Developer Productivity — METR
- Goldman Sachs Analysis of AI Mentions on S&P 500 Earnings Calls (Fortune)
- The AI Moment? Possibilities, Productivity, and Policy — Mary C. Daly (Federal Reserve Bank of San Francisco)
- 2025 White Paper on Information and Communications: Individual Use of Generative AI (Ministry of Internal Affairs and Communications)
- 2025 White Paper on Information and Communications: Corporate Use of Generative AI (Ministry of Internal Affairs and Communications)
- Survey on Corporate Trends in Generative AI, March 2026 (Teikoku Databank, PDF)
- Generative AI Survey 2025 Spring: Five-Country Comparison (PwC Japan)
- The Tragedy of AI PoCs Launched Half-Baked (EnterpriseZine)
- Inside Uchida Yoko's Company-Wide Microsoft 365 Copilot Adoption (キーマンズネット)
- We Rolled Out Generative AI and Sales Won't Use It (NTT DATA Data Insight)
- AI Usage Survey: 34.8% Use AI Tools at Work Without Permission (SIGNATE, PR TIMES)
- Survey on Workers' Use of Generative AI (Persol Research and Consulting)